Plotting With Plotly
Please Log In for full access to the web site.
Note that this link will take you to an external site (https://shimmer.mit.edu) to authenticate, and then you will be redirected back to this page.
Error on line 3 of Python tag (line 4 of source):
    student_servername =  BASE_SERVER+"/"+STUDENT_SERVERS[cs_username]['endpoint']

KeyError: 'None'
Last week we got data onto our server and we were able to recall it and display it (albeit poorly). This week we'll focus on presenting it in a nicer format for human consumption.
We need to install some libraries to do things, so do the following four (make sure to do this in the same python virtual environment you used last time for your server):
Install numpy, this might already be installed, but just do it anyways:
pip3 install numpy
Install pandas, a really cool data manipulation library:
pip3 install pandas
Install plotly, a really cool plotting library:
pip3 install plotly
Install jinja2, a HTML template library:
pip3 install jinja2
Ok.
FastAPI and HTML Return
Last week you basically just dumped your raw text out. You may have viewed in the web browser, simply because that was the easiest way to view it, but that' really missing the point of a web browser. Web browsers are designed to handle and render HTML. While FastAPI at its most basic just retuns raw data, it can also be used to return HTML and it has quite a decent set of tools and a framework built up around that.
A very simple HTML page has the following source code:
<!doctype html>
<html>
 <body>
  <h1>Test Title!</h1>
  <p>It is a day in the history of the universe.</p>
</body>
</html>
This exact HTML document is served here. Upon going there you'll see it looks "prettier" because the browser has rendered it, but behind the scenes all that was delivered from the server was the text above. If you don't believe this, right/control click on the page and find "View Page Source." That will pop up a second brower window showing the code that created this.
You can serve raw HTML in FastAPI pretty easily.
First bring in the HTMLResponse object. This will take care of setting the appropriate response headers (in particular it will set a content-type header to be text/html which will help web browsers know to interpret the text as HTML.
from fastapi.responses import HTMLResponse
Then create a string that contains the HTML source code above and finally return (maybe put it into a variable called output or something) and then for a given FastAPI GET endpoint, return the following
return HTMLResponse(content=output, status_code=200)
The status code specification (of 200) is a way to also indicate "success" to the receiving entity (as opposed to a "404" not found or "502" bad gateway, etc...)
For a first assignment, make a FastAPI endpoint in the same application as last week called basic_html that returns the same HTML page above. With the appropriate ssh command running as well as your Fast API application running, the checker below will hit:
Error on line 1 of Python tag (line 73 of source):
    print('%s' % (student_tunnel,))

NameError: name 'student_tunnel' is not defined
Syntax error in question tag: File "<string>", line 8 output = "".join(requests.get(f"<div><font color='red'><b>A Python Error Occurred:</b><p><pre>Error on line 1 of Python tag (line 82 of source): ^ SyntaxError: unterminated string literal (detected at line 8)
Templating
Because we made the HTML document up within Python it does open the door to programatically modifying it rather than always just returning the same thing. You could image having a piece of code that does something like the following using Python f-strings.
  now = datetime.datetime.now()
  output = rf'''
<!doctype html>
<html>
 <body>
  <h1>Test Title!</h1>
  <p>The current time is {now}!</p>
</body>
</html>
'''
  return HTMLResponse(content=output, status_code=200)
This could get a little gross, though and it also can start to get overwhelming having large gigundous HTML strings in your Python code...things get hard to read and it is just a mess. Instead, this is where HTML templates come in. Templates are a way to make customized HTML from Python. It is basically a merger of serving a static html source like we just did and the ability to create dynamic content like we did we've been doing already with our FastAPI framework. In your FastAPI application directory, add a folder called templates. Into that folder make a file called template_1.html and into that file we'll add the following text:
Now in your FastAPI application, add a few new import and setup lines:
from fastapi import Request
from fastapi.staticfiles import StaticFiles
from fastapi.templating import Jinja2Templates
templates = Jinja2Templates(directory="templates")
Into the templates directory we're add the following file (call it template_1.html):
<!doctype html>
<html>
 <body>
  <h1>A HTML Title with {{ id }} in it</h1>
  <p>The current time is {{ time_stamp }}!</p>
</body>
</html>
Now this file looks mostly like a regular HTML file with the notable exception of those double bracket entries {{ id }} and {{ time_stamp }}. These things can get replaced with run-time-specified values. How do we specify those values? With an endpoint that looks something like the following:
@app.get("/template_test/{id}", response_class=HTMLResponse)
async def read_item(request: Request, id: str):
    now = datetime.datetime.now()
    return templates.TemplateResponse(
        request=request, name="template_1.html", context={"id": id, "time_stamp":now }
    )
A TemplateResponse object is uses the specified template as a starting point and replaces specified variables where appropriate. A working version of this exact FastAPI endpoint can be seen here....feel free to change the ending number to whatever you want (doesn't even have to be a number actually...refresh some times. You should see the timestamp updated and the "ID" value change as you change the inputs.
It probably doesn't even need to be said that structuring things this way can help with organization especially when/if you start having massive HTML files with lots of javascript, css, etc... keep all that stuff out of your Python.
Note: The code above is using a variation in the endpoint (the id value) as an input for the system rather than a query argument. I'm putting this here just so you have an example of a different way to take inputs in FastAPI...you can still make this type of thing work with Query arguments (from last week) and everything else. The data can also come from prior history (like from databases, etc...). The possibilities are endless.
Plotting
OK, now what we'd like to do is make a pretty looking plot and use it with a template. First let's update the libraries we import for our Flask application. At the top add these:
import pandas as pd
import plotly
import plotly.express as px
import json
Next in our templates directory add in a template that will have some boilerplate stuff that can render a plot. Call this template whatever you want, but remember the name since you'll be linking/using it in a bit.
To download the template code, go here.
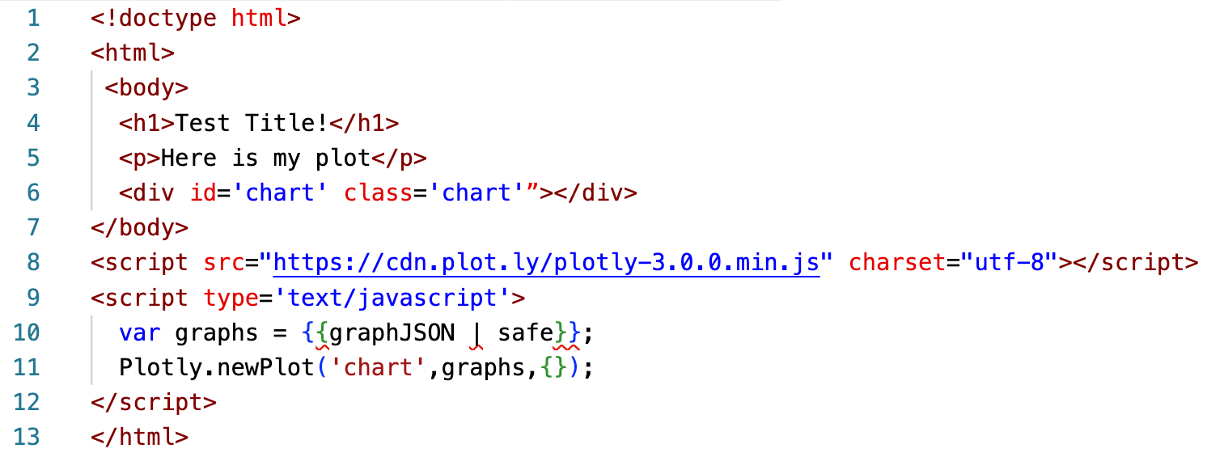
The template is mostly fixed content. The only thing that is different is a variable we'll inject called graphJSON. What this variable will contain will be a large JSON object that will contain all the material needed for the Plotly javascript libraries to render a really nice, interactive plot. Our job, on the Python/Flask side will be to generate that JSON object...and we'll use Plotly's Python library to do so. In this way, we basically avoid having to write javascript or anything directly, and instead just use Python to do it for us, and that's good because Javascript is a disgusting, disgusting language.
The library and documentation for Plotly can be found here. In general, plotly's documentation is very good since they have a financial interest in you using their stuff (they let you use it for free and then try to hook you once you're using it in a commercial setting just like drug dealers or MATLAB). Anyways, you can totally mess around with Plotly locally on your computer. Everything you do locally can be deployed on the server. The big difference, however, is that when you locally call fig.show(), a new browser tab/window opens displaying your generated figure. In the context of a hosted server though, you'll need to just pipe your figure into a JSON object using a function call that the plotly python library provides:
    graphJSON = json.dumps(fig, cls=plotly.utils.PlotlyJSONEncoder)
    return render_template('temp_plot.html', graphJSON=graphJSON)
An example of putting this all together is shown below :
@app.get("/test_plot/{num_points}")
def plotter(request: Request, num_points: int):
    xs = list(range(num_points)) # make 100 points
    ys = [random.random() for i in xs] #import random! then assign random y values
    # make a nice data frame using pandas
    df = pd.DataFrame({
       'x': xs,
       'y': ys,
    })
    #make a line plot using pandas:
    fig = px.line(df, x='x', y='y')
    graphJSON = json.dumps(fig, cls=plotly.utils.PlotlyJSONEncoder)
    return templates.TemplateResponse(
        request=request, name="plotly_base.html", context={"graphJSON": graphJSON}
    )
The result of this plotting code is shown HERE. I am generating random numbers (the quantity of which are determined by the num_points endpoint), and plotting them in conjuction with a modified template from above. Every time you hit that page, a different plot will show up.
Assignment
OK, using your SQL skills from last week, retrieve your previously logged (and maybe continually logged) data. Then, create 3 separate line graphs: one plotting temperature vs. time, one plotting relative humidity vs. time, and one plotting soc vs. time. The plots should be at three separate endpoints in your application:
temp_plotrh_plotsoc_plot
Each endpoint should also take a query argument (so not what is done above) called num_points to specify how many points are being plotted with timestamps on the x axis and the appropriate units of Degrees, %, and %, for temperature, relative humidity, and SOC, respectively. Again, your plots should have temperature/relative humidity/soc on the y axis and the date on the x/t axis. You will need to do some digging into the plotly docs to see how to use timestamps appropriately! Make sure you're testing and developing this with your data that you collected previously.
For the submission at the bottom of the page, zip up your entire FastAPI applicatoin (database, templates, etc...) and submit below. Make sure it will just work when Joe or the grader downloads it, unzips, and runs it. If Joe has to reverse engineer what it is doing, it will lose points. So it should be testable with the following endpoints:
http://localhost:8000/temp_plot?num_points=100, etc for temperature plotshttp://localhost:8000/rh_plot?num_points=80, etc for relative humidity plotshttp://localhost:8000/soc_plot?num_points=20, etc for battery state of charge plots
